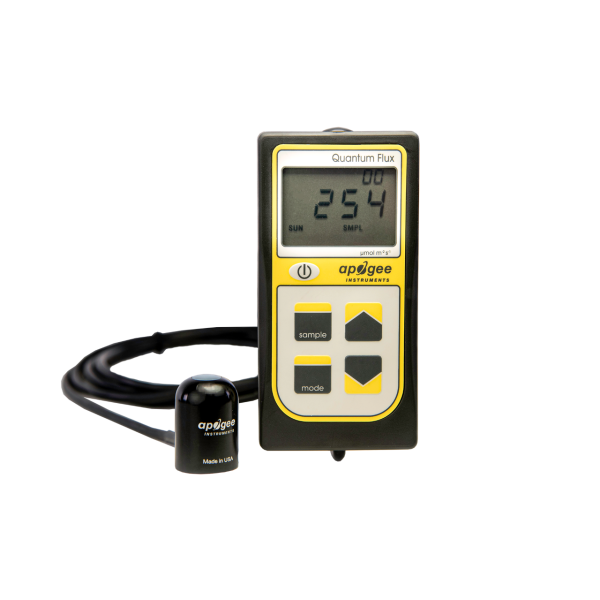
Apogee MQ-200X Quantum-Meter
Quantum Original Sensor
- waterproof quantum sensor
- fast response time
- accurate measurements
- Manufacturer:Apogee Instruments
- SKU:13126
Photosynthetic radiation is essential for the growth of the photosynthetic organisms such as corals. The wavelength range from 400 to 700 nm is PAR (Photosynthetically Active Radiation) or PPFD (Photosynthetic Photon Flux Density). Apogee quantum/PAR sensors are calibrated to measure the number of photons of light across this range.
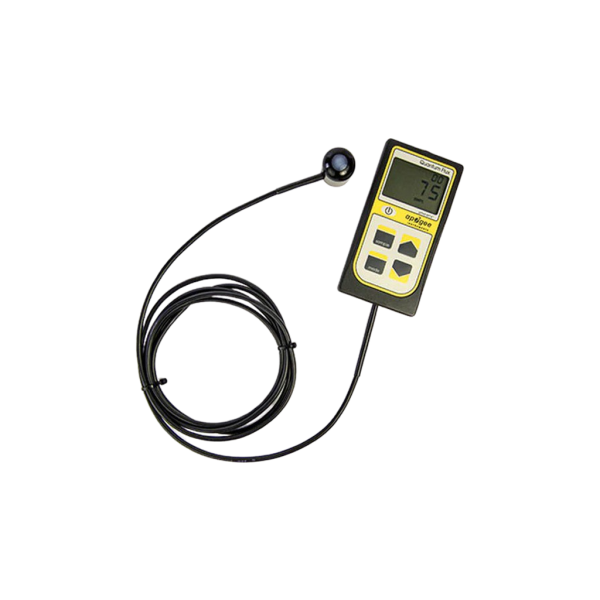
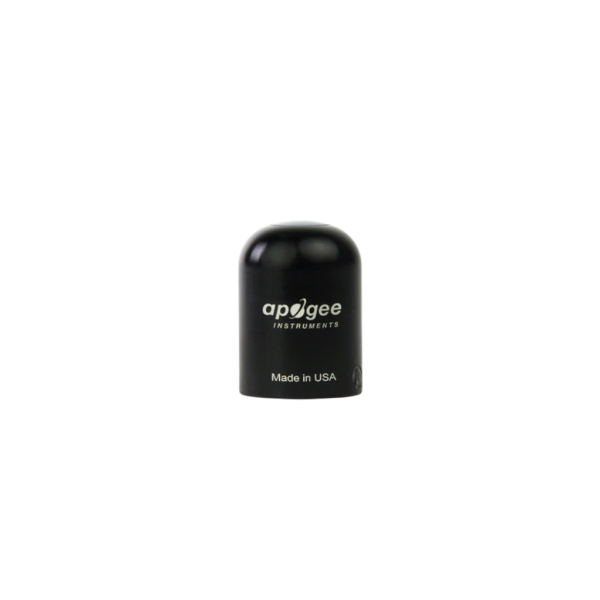
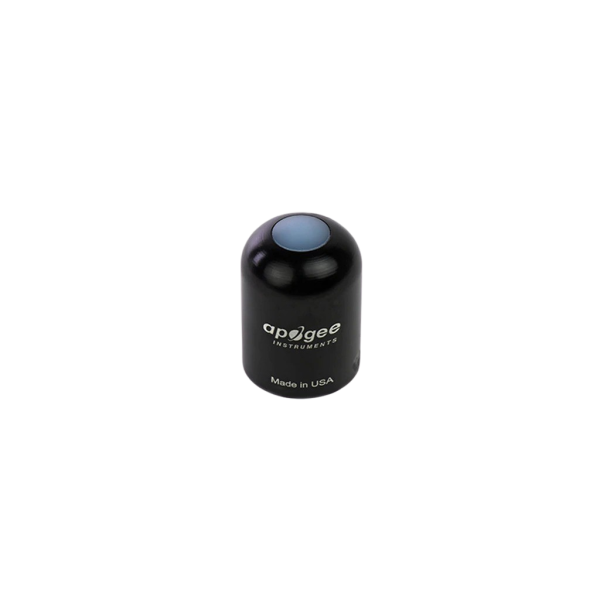
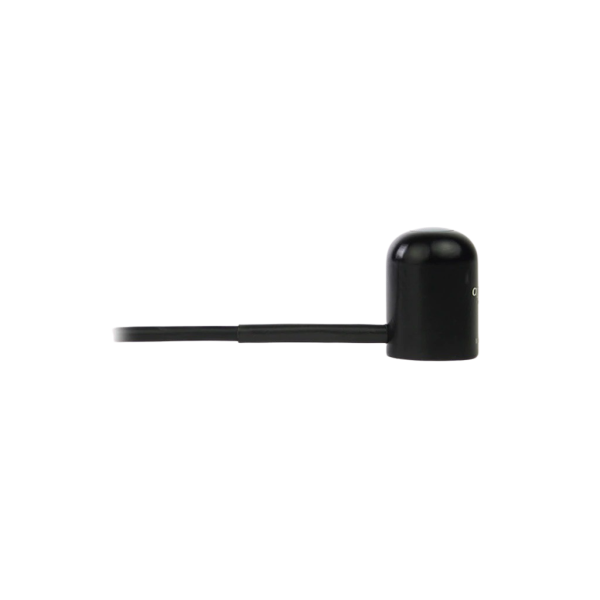
Waterproof Quantum-SensorThe MQ-200 has a hand-held meter, attached via cable, that displays and stores measurements. The sensor head features a fully potted, domed-shaped design making it fully waterproof, weatherproof and self-cleaning.
Underwater PAR MeasurementsQuantum sensors are increasingly used to measure photosynthetic photon flux density (PPFD, units of µmol m-2 s-1) underwater, which is important for biological, chemical, and physical processes in natural waters and in aquariums. When a quantum sensor that was calibrated in air is used to make underwater measurements, the sensor reads low.
This phenomenon is called the immersion effect and happens because the refractive index of water (1.33) is greater than air (1.00). The higher refractive index of water causes more light to be backscattered (or reflected) out of the sensor in water than in air (Smith, 1969; Tyler and Smith, 1970). As more light is reflected, less light is transmitted through the diffuser to the detector, which causes the sensor to read low. When this effect is not corrected for, underwater measurements are only relative, which makes it difficult to compare light in different environments.
The Apogee Full-Spectrum Quantum Sensor (model SQ-500) is more spectrally accurate than the Original Quantum Sensor (model SQ-120-SS), but the unique optics (mainly the shape) cause the immersion effect to be larger for the new sensor. Underwater PAR measurements collected using a full-spectrum sensor can be corrected by multiplying by 1.32; measurements collected using an original Apogee sensor should be multiplied by 1.08*.
The MQ-210 and MQ-510 Underwater Quantum Meters already apply the immersion effect correction factor to the meter readings through the meter firmware. Additionally, the SQ-420 and SQ-520 have an "Immersion Setting" that applies the immersion effect correction factor to the sensor readings through the ApogeeConnect Software. These sensors do not need post-measurement corrections applied to their measurements.
Typical ApplicationsTypical applications include PPFD measurement over plant canopies in outdoor environments, greenhouses, and growth chambers, and reflected or under-canopy (transmitted) PPFD measurements in the same environments.
Quantum sensors are also used to measure PAR/PPFD in aquatic environments, including salt water aquariums where corals are grown.
The meter has a sample and log mode, and will record an integrated daily total in mol m-2 d-1. Sample mode will record up to 99 manual measurements. Log mode will power the meter on/off to make a measurement every 30 seconds.
Every 30 minutes the meter will average the sixty 30 second measurements and record the averaged value to memory. The meter can store up to 99 averages, once full it will start to overwrite the oldest measurement with new ones. An integrated daily total will be recorded from the 48 averaged measurements (making a 24 hr period).
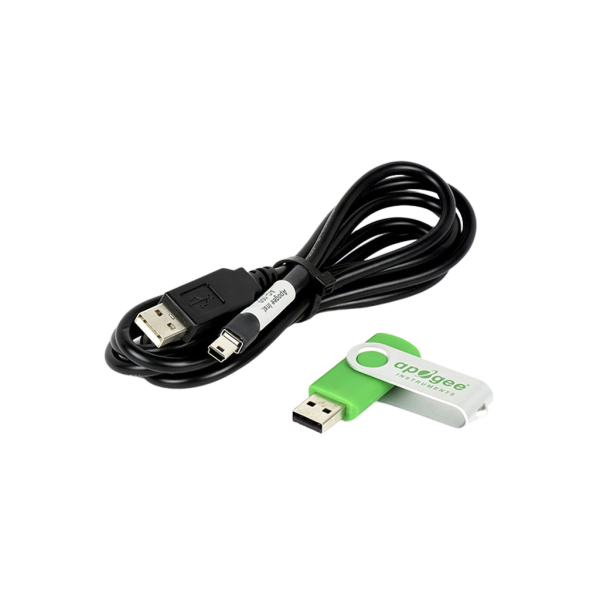
Sample and log measurements can be reviewed on the LCD display or by downloading the data to a computer, however, the integrated daily total can only be viewed by downloading the data to a computer. Downloading data to a computer requires the AC-100 communication cable (a standard USB cable will not work) and Apogee-AMS-Software.
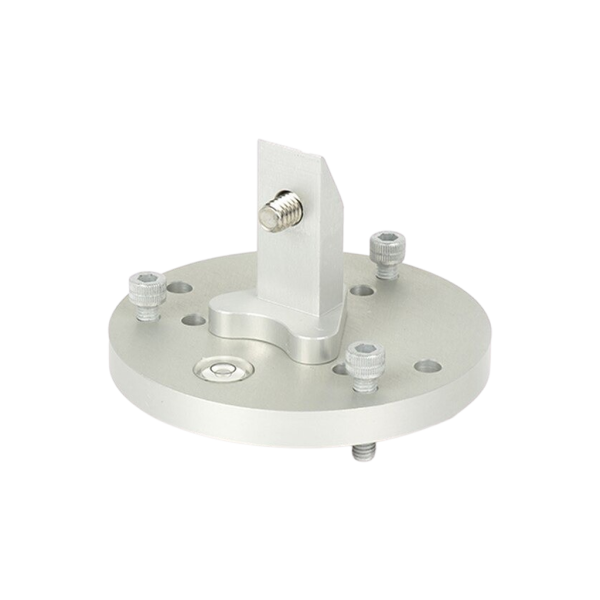
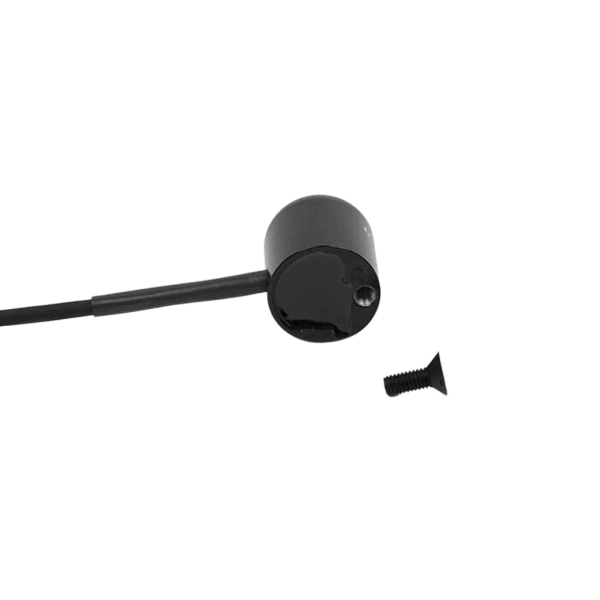
MountingThe AL-120 Solar Mounting Bracket with Leveling Plate facilitates mounting the sensor to a mast or pipe. The AL-100 Solar Sensor Leveling Plate is designed to level the sensor while sitting on a flat surface or mounting to a Surface.
Apogee MQ series quantum meters are designed for spot-check measurements, and calculation of daily light integral (DLI; total number of photons incident on a planar surface over the course of a day) through the built-in logging feature. To accurately measure PFFD incident on a horizontal surface, the sensor must be level. For this purpose, each MQ model comes with a different option for mounting the sensor to a horizontal plane.
The AL-210 leveling plate is recommended for use with the MQ-100. The AL-100 leveling plate is recommended for use with the MQ-200.
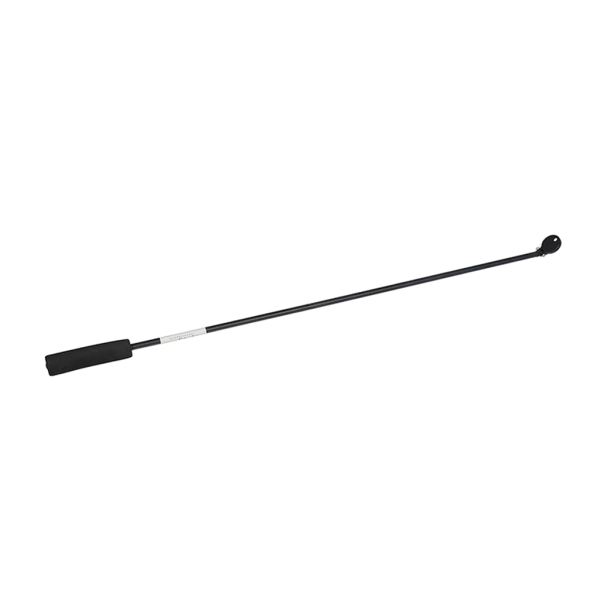
MQ-300 series line quantum sensors are leveled using the built-in bubble level located in the handle of the sensor. In addition to leveling, all sensors should also be mounted such that obstructions (e.g., weather station tripod/tower or other instrumentation) do not shade the sensor.
MQ series quantum meters are designed with a user-friendly interface allowing quick and easy measurements.
To power the meter, slide the included battery (CR2320) into the battery holder, after removing the battery door from the meter’s back panel. The positive side (designated by a “+” sign) should be facing out from the meter circuit board.
- Press the power button to activate the LCD display. After two minutes of non-activity the meter will revert to sleep mode and the display will shut off to conserve battery life.
- Press the mode button to access the main menu, where the appropriate calibration (sunlight or electric light) and manual or automatic logging are selected, and where the meter can be reset.
- Press the sample button to log a reading while taking manual measurements.
- Press the up button to make selections in the main menu. This button is also used to view and scroll through the logged measurements on the LCD display.
- Press the down button to make selections in the main menu. This button is also used to view and scroll through the logged measurements on the LCD display.
The LCD display consists of the total number of logged measurements in the upper right hand corner, the real-time PPFD value in the center, and the selected menu options along the bottom.
Calibration: To choose between sunlight and electric light calibration, push the mode button once and use the up/down buttons to make the appropriate selection (SUN or ELEC). Once the desired mode is blinking, press the mode button three more times to exit the menu.
Logging: To choose between manual or automatic logging, push the mode button once and use the up/down buttons to make the appropriate selection (SMPL or LOG). Once the desired mode is blinking, press the mode button two more times to exit the menu. When in SMPL mode press the sample button to record up to 99 manual measurements (a counter in the upper right hand corner of the LCD display indicates the total number of saved measurements). When in LOG mode the meter will power on/off to make a measurement every 30 seconds. Every 30 minutes the meter will average the sixty 30 second measurements and record the averaged value to memory. The meter can store up to 99 averages and will start to overwrite the oldest measurement once there are 99 measurements. Every 48 averaged measurements (making a 24 hour period), the meter will also store an integrated daily total in moles per meter squared per day (mol m-2 d-1).
Reset: To reset the meter, in either SMPL or LOG mode, push the mode button three times (RUN should be blinking), then while pressing the down button, press the mode button once. This will erase all of the saved measurements in memory, but only for the selected mode. That is, performing a reset when in SMPL mode will only erase the manual measurements and performing a reset when in LOG mode will only erase the automatic measurements.
Review/Download Data: Each of the logged measurements in either SMPL or LOG mode can be reviewed on the LCD display by pressing the up/down buttons. To exit and return to the real-time readings, press the sample button. Note that the integrated daily total values are not accessible through the LCD and can only be viewed by downloading to a computer.
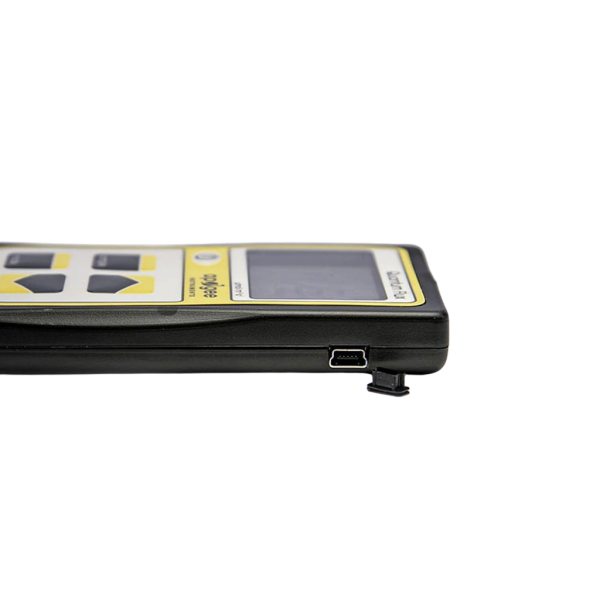
Downloading the stored measurements will require the AC-100 communication cable and software (sold separately). The meter outputs data using the UART protocol and requires the AC-100 to convert from UART to USB, so standard USB cables will not work. Set up instructions and software can be downloaded here from the Apogee website.
| Dimensions (LxWxH): | 126 x 70 x 24 mm |
| Spectral Range: | 410 nm to 655 nm (wavelengths where response is greater than 50 % of maximum) |
| Long-term Drift (Non-stability): | Less than 2 % per year |
| Response Time: | Less than 1 ms |
| Operating Environment: | 0° to 50° C; less than 90 % non-condensing relative humidity up to 30° C; less than 70 % non-condensing relative humidity from 30° to 50° C; separate sensors can be submerged in water up to depths of 30 m. |
| Sensor Dimensions: | 24 mm diameter, 28 mm height |
| Cable: | 2 m of shielded, twisted-pair wire with TPR jacket (high water resistance, high UV stability, flexibility in cold conditions), additional cable available. |